An RF site survey is the process of identifying areas of RF coverage and the factors that may adversely affect the performance of a wireless network.
The objective is straightforward: understand the RF environment before deploying the network, identify potential problems, and incorporate those findings into the radio network design.
But an effective RF survey involves considerably more than simply checking whether a radio can be heard from a particular location.
It combines predictive modelling, spectrum analysis, physical site assessment and real-world validation.
Predictive RF Analysis
The first stage of an RF survey is usually performed before visiting the site.
This is sometimes referred to as predictive analysis or desktop RF planning.
Tools such as [CloudRF] can be used to model expected RF propagation based on information such as terrain, vegetation, antenna characteristics, frequency, transmitter power and receiver sensitivity.
The result is a predicted coverage map showing where the radio network should provide adequate coverage.
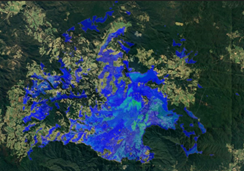
— Image: predictive RF coverage map —
This allows the proposed coverage area to be overlaid onto the prediction and gives us an early indication of whether the proposed site and radio configuration are suitable.
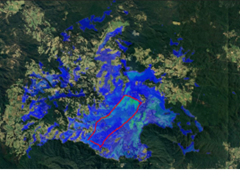
It can also identify potential problem areas before equipment is installed.
That is important because moving an antenna or selecting a different site on a computer is considerably easier than discovering the problem after the installation is complete.
RF Spectrum Analysis
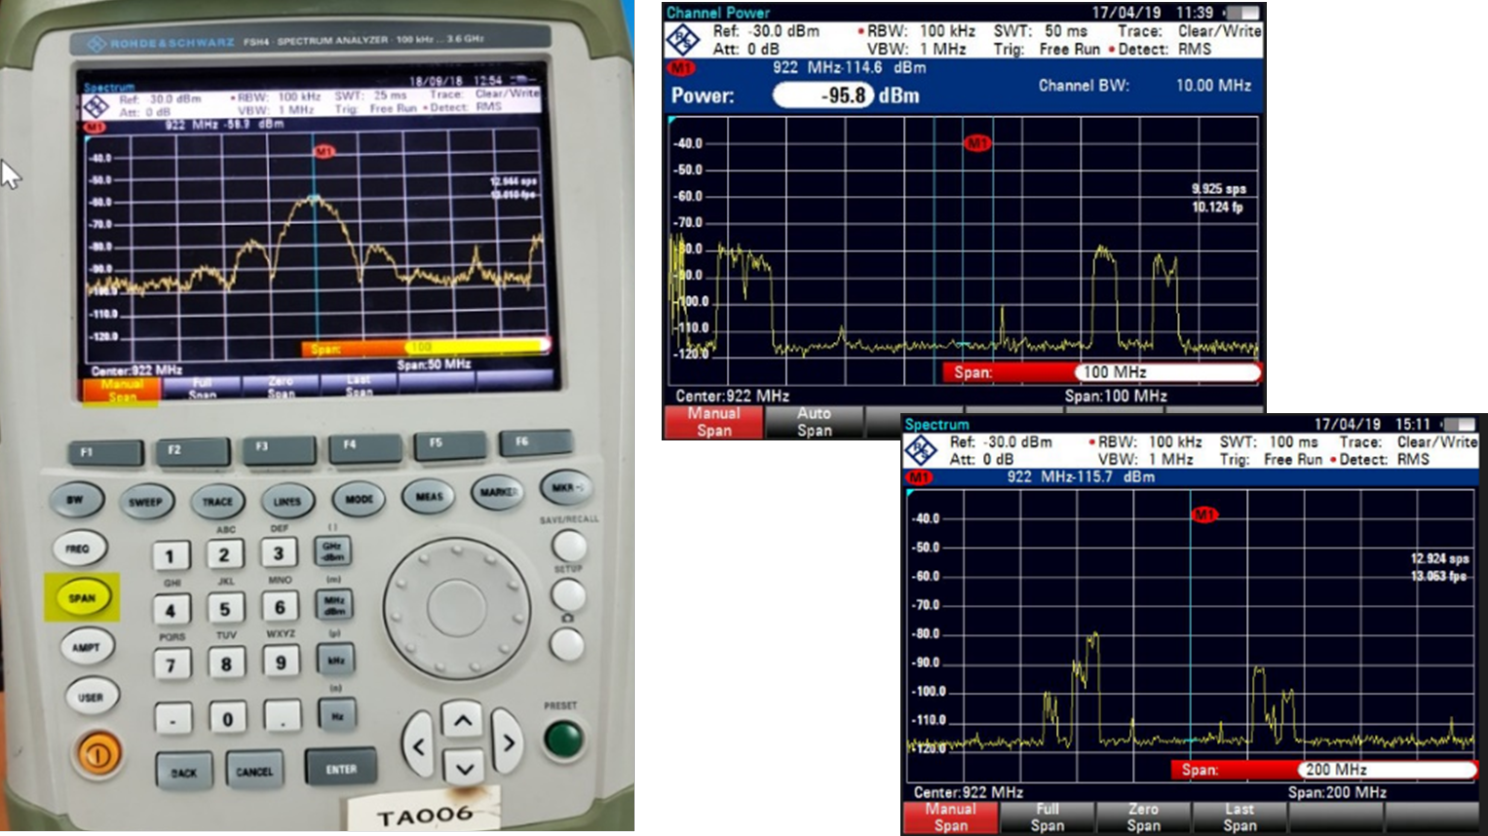
Once the predicted coverage looks suitable, the next stage is to understand what is actually happening in the RF environment.
This requires an on-site spectrum analysis.
A portable spectrum analyser is used to measure the RF spectrum and identify potential sources of interference and noise.
This is particularly important because a frequency that looks clean on a planning map may not be clean at the actual installation site.
We need to understand:
- What RF signals are present?
- How strong are they?
- Where are they located in the spectrum?
- Are there intermittent signals?
- Is there significant noise?
- Are there strong signals in adjacent frequency bands?
The last point is particularly important for sensitive receivers.
A receiver may be designed to operate on a particular frequency, but a very strong signal close to that frequency can still cause problems.
In some situations, the solution is to introduce additional filtering.
What is a cavity filter?
No, it has nothing to do with teeth.
A cavity filter is a sharply tuned resonant circuit designed to allow a particular frequency or frequency range to pass while rejecting unwanted signals.
Unlike many electronic filters, cavity filters contain no active components and can provide extremely effective filtering.
There is, however, a price to pay.
A cavity filter introduces some insertion loss — potentially several dB — so it is normally used only when there is a good reason to do so.
The following measurements demonstrate the effect of a cavity filter.
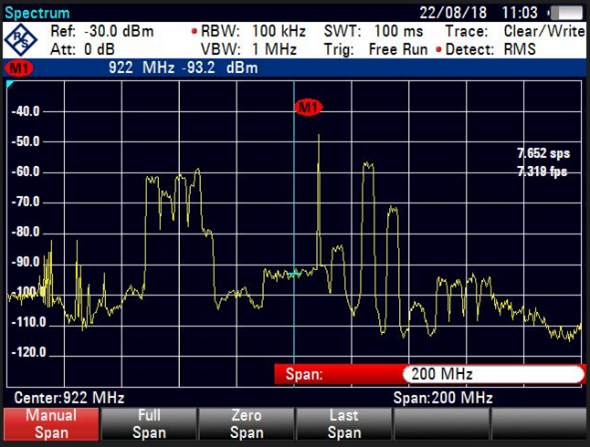
— Image: spectrum before cavity filter —
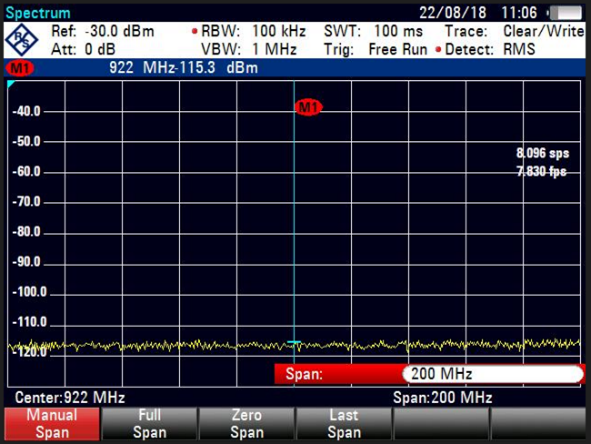
— Image: spectrum after cavity filter —
The two measurements were taken at the same location and under the same conditions. The difference demonstrates how effectively the unwanted signal can be suppressed.
Validating the Installation
Predictive modelling and spectrum analysis give us a high degree of confidence in the design, but the job isn't necessarily finished when the equipment is installed.
For critical installations, we may perform spot checks in fringe coverage areas to verify that the actual network performance meets or exceeds the predictions.
This involves physically visiting locations within the coverage area and measuring the received signal.
Those measurements can then be plotted on a map to provide a visual representation of the actual coverage.
This gives us three useful pieces of information:
What we predicted.
What the RF environment actually looked like.
What the installed system actually achieved.
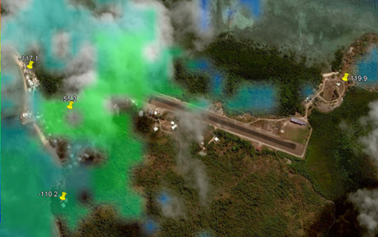
Comparing these allows us to validate the original design and identify any differences between the model and reality.
Receiver Sensitivity Matters
The relationship between received signal strength and the noise floor is particularly important when assessing coverage.
The receivers used in these systems are extremely sensitive and can often decode signals approximately 20 dB below the noise floor, depending on the system and operating conditions.
For example, a received signal around -119.9 dBm may still be usable when the typical noise floor is around -110 dBm.
This illustrates why simply looking at received signal strength isn't enough.
The important question isn't just:
How strong is the signal?
It is:
How does the signal compare with the noise and interference present at the receiver?
That distinction is fundamental when determining the real usable coverage of an RF system.
Monitoring the Installation
The RF environment doesn't necessarily remain the same after the network is commissioned.
New transmitters can appear.
Existing equipment can change.
Noise sources can develop.
The surrounding environment can change.
Any of these can degrade a network that previously performed perfectly.
For this reason, installed systems can be continuously monitored.
One approach is to periodically generate a PSD (Power Spectral Density) plot of the spectrum being observed by the receiver.
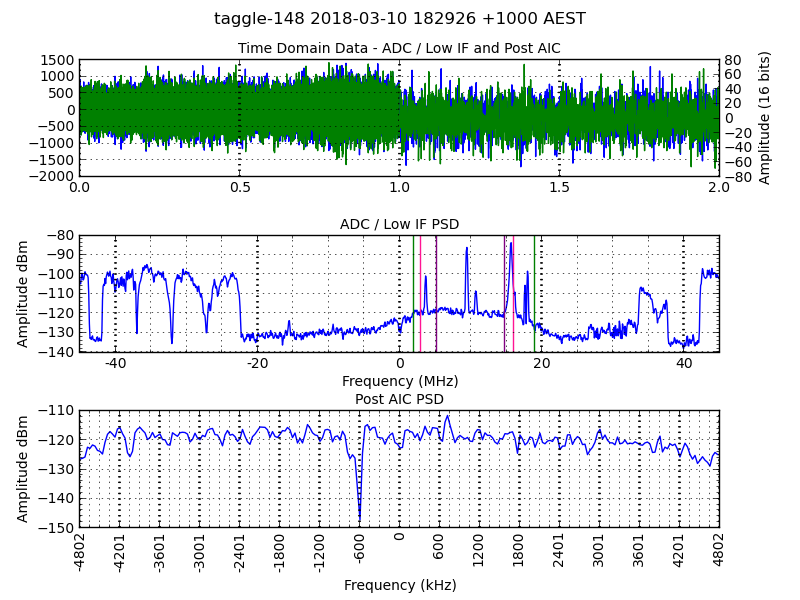
In this case, the process can be automated to run every six hours.
The resulting measurements can be compared against an established baseline. Significant changes in the RF environment can then generate an alarm and trigger further investigation.
This changes RF monitoring from a reactive process into a proactive one.
Instead of waiting for users to report degraded performance, we can potentially identify a change in the RF environment before it becomes a network problem.
The Fun Part
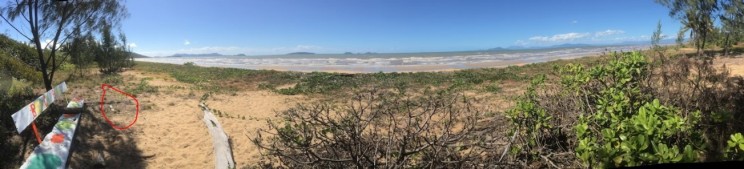
RF surveying can be a little bit of hard work mixed with a fair amount of fun.
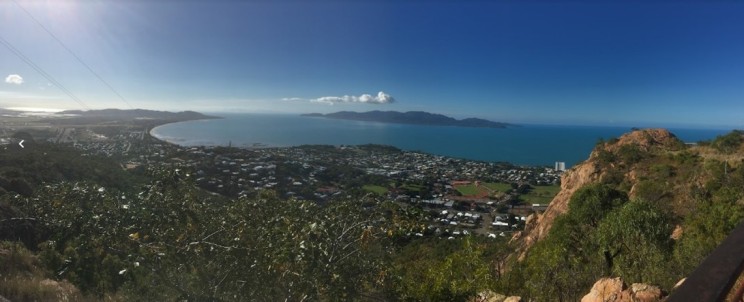
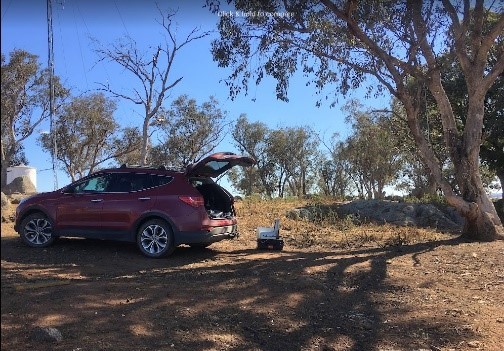
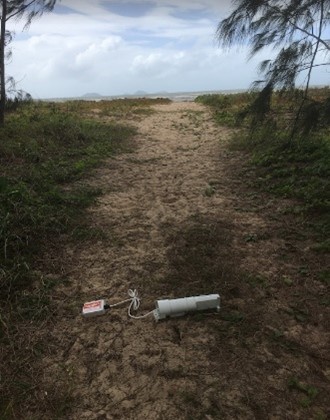
One of the best parts of the job is getting out of the office and seeing the environments in which the network actually has to operate.
That can mean travelling to some very interesting places and, occasionally, some fairly remote ones.
Those who have followed my previous posts will probably recognise some of the locations from the photographs I've shared over the years.
But there is a very practical reason for all that travelling.
Terrain matters.
A radio propagation model can provide an excellent prediction, but the quality of that prediction depends on how well we understand the environment in which the system has to operate.
A useful way of putting it comes from Dave Peterson:
"Terrain matters."
A solid understanding of RF propagation is essential when developing a communications plan.
And one of the best ways to understand the terrain is to actually visit it.
Planning Is Only Half the Job
RF engineering doesn't end when the coverage map looks good.
The real process is a continuous loop:
Predict → Measure → Install → Validate → Monitor → Improve
Desktop modelling tells us what we expect.
Spectrum analysis tells us what is actually present.
Field measurements tell us whether the installed system performs as expected.
And ongoing monitoring tells us whether the environment remains suitable over time.
That combination is what turns an RF plan into a functioning RF network.
And yes, sometimes the best way to verify all of that is to get in the car and go see it for yourself.
Not only is it good engineering — it's also a lot more fun.